 |
Jordan Roy-Byrne, CMT, MFTA |
TheDailyGold: Gold's Best Historical Comparison...
Published: Tue, 06/07/22
|
|
|
Right now there are two historical comparisons for Gold. This is based purely on Gold's price action. (Overall, the best comp is the late 1960s, but I digress).
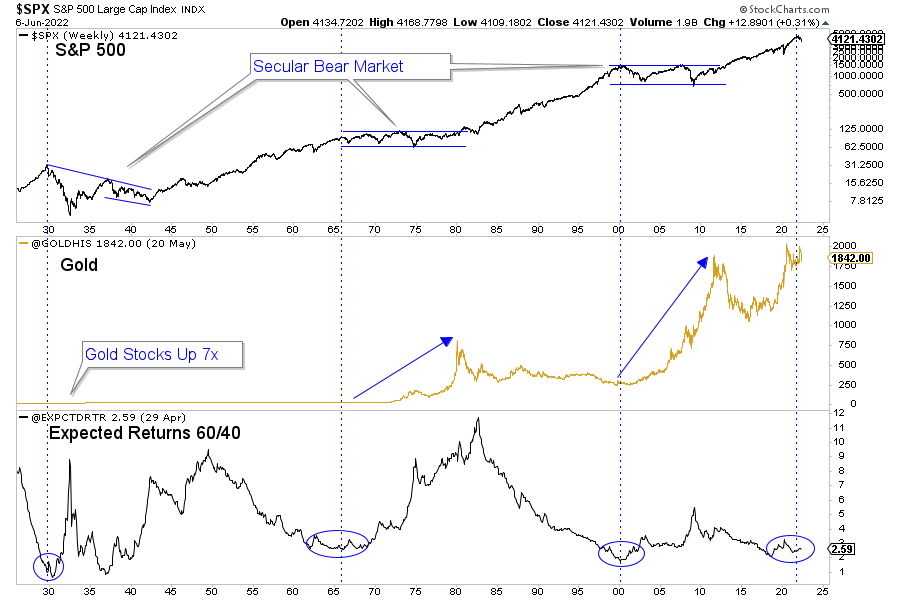
I'm talking about Gold's price action. Click Here to Read My Article In this video I discuss one simple indicator for Gold (it leads Fed policy). I also discuss my current macro-market outlook & how that may impact Gold. Click Here for My Analysis in Video The price of Oil can be an indicator for the gold stocks. The rise in Oil has impacted precious metals negatively. In this video I analyze the outlook for Oil and what it could mean for the macro-market picture & Gold and gold stocks. Click Here for My Analysis in Video ------------------------------------------------------------------------------------------- This chart plots the S&P 500, Gold and an expected returns calculation.
That calculation is for a 10-year annualized return for a conventional 60/40 portfolio. I created the calculation from Bob Schiller's Excess CAPE Yield data (which attempts to project equity returns) and the 10-year Treasury yield.  ------------------------------------------------------------------------------------------- In TheDailyGold Premium...
-------------------------------------------------------------------------------------------
|