 |
Jordan Roy-Byrne, CMT, MFTA |
TheDailyGold: The #1 Long-Term Indicator for Gold...
Published: Fri, 07/29/22
|
|
|
This past week I have been thinking quite a bit about, what I consider to be, the #1 indicator for Gold's long-term performance.
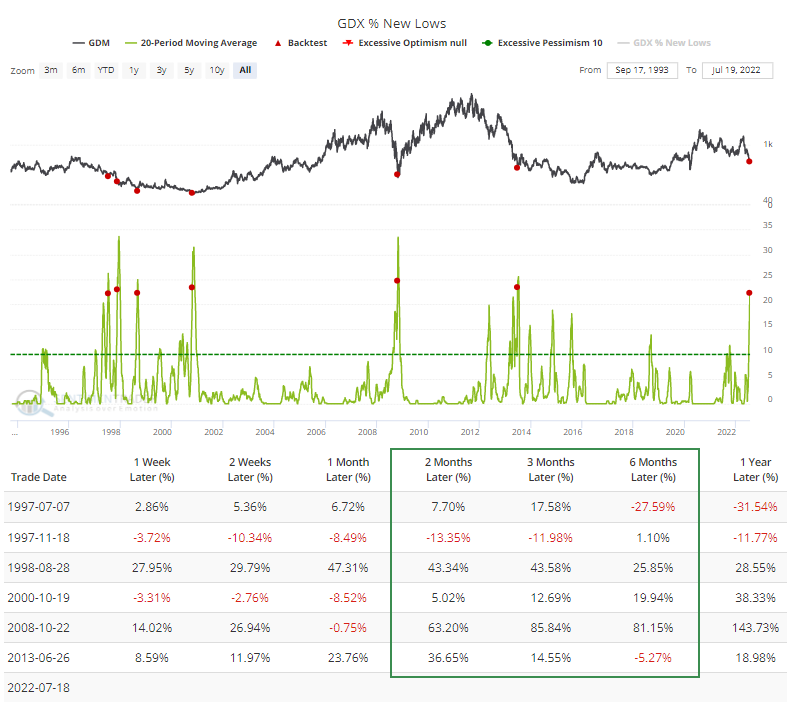
I wrote about last Sunday. Click Here to Read My Article I discuss the content of the article and provide a bit more analysis in the video below. Click Here for the Video ------------------------------------------------------------------------------------------- This chart from SentimenTrader.com, plots a 20-day moving average of the new 52-week lows in GDX (using the parent index).
Aside from the cluster around 1998, you have the low in 1999 (Gold's low of $252), the low in 2001 (Gold's epic low at $255) and then the 2008 low and a low after the crash in 2013.  ------------------------------------------------------------------------------------------- In TheDailyGold Premium...
My current thinking is ........ the market thinks the Fed will not move fast enough or aggressive enough to counter the recession and awakening of the deflation beast. Perhaps we see some similarities to 2008 over the coming months. Ultimately, after the S&P 500 makes a lower low, the Fed cuts rates and there are calls for fiscal stimulus, the precious metals bull will be
launched. Very short term, the miners remain extremely oversold and I would not be surprised to see some strength after the Fed decision on Wednesday. There might be a bit of speculation September will be the last hike, and especially if bond yields dump lower into August.
-------------------------------------------------------------------------------------------
|