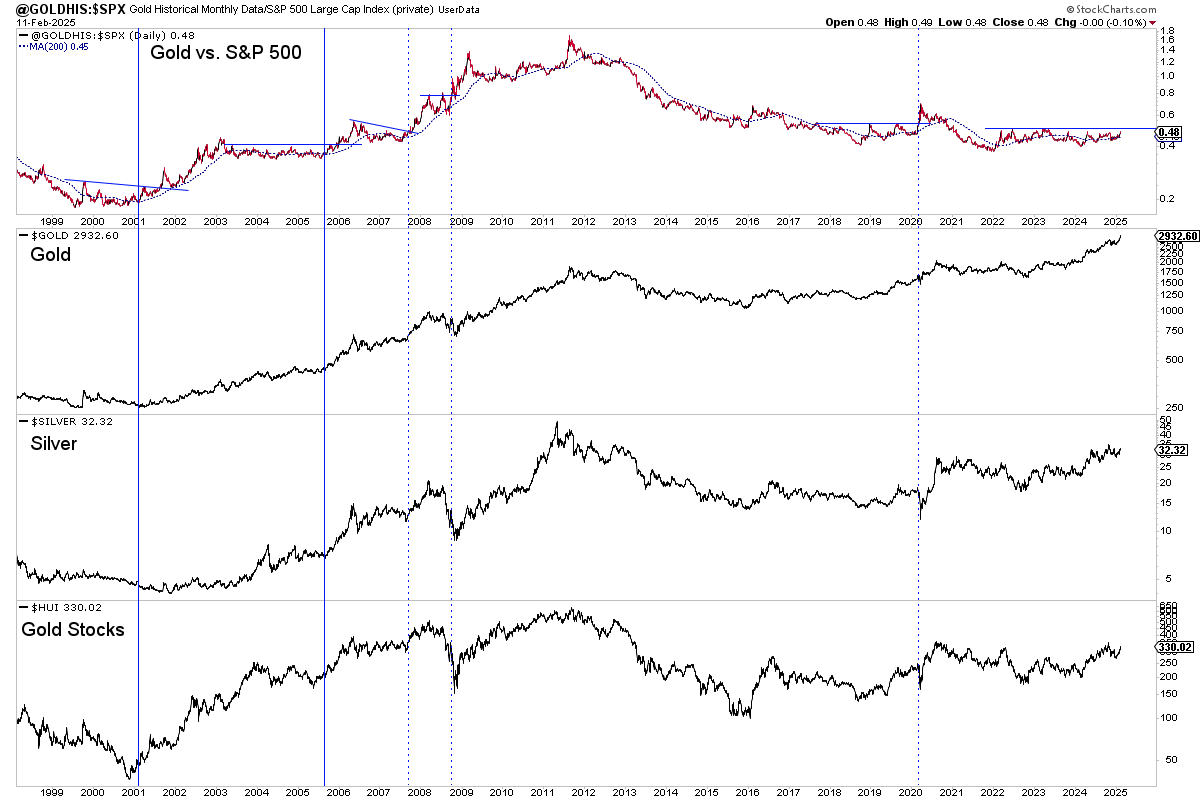
Gold vs. S&P 500: 2000-2025
Click the image for full size.
The blue lines mark the start of the breakout moves in the ratio. The thicker blue lines are most instructive, in our
opinion.
The ratio regained the 200-day moving average for good in early 2001, just before Gold completed its double bottom. The gold stocks bottomed a few months earlier while Silver did not bottom until later that year.
Gold, Silver and gold stocks had rebounded from a minor bear
market (2004-2005) for a few months before the breakout move began. Everything moved higher and there was no interruption.
The breakouts in 2008 and 2020 were around market crashes.
In 2008, precious metals were already in a downtrend. The sector put
in an epic bottom roughly one month after the ratio broke-out.
In 2020, precious metals bottomed three weeks after the first signs of a breakout in the ratio.