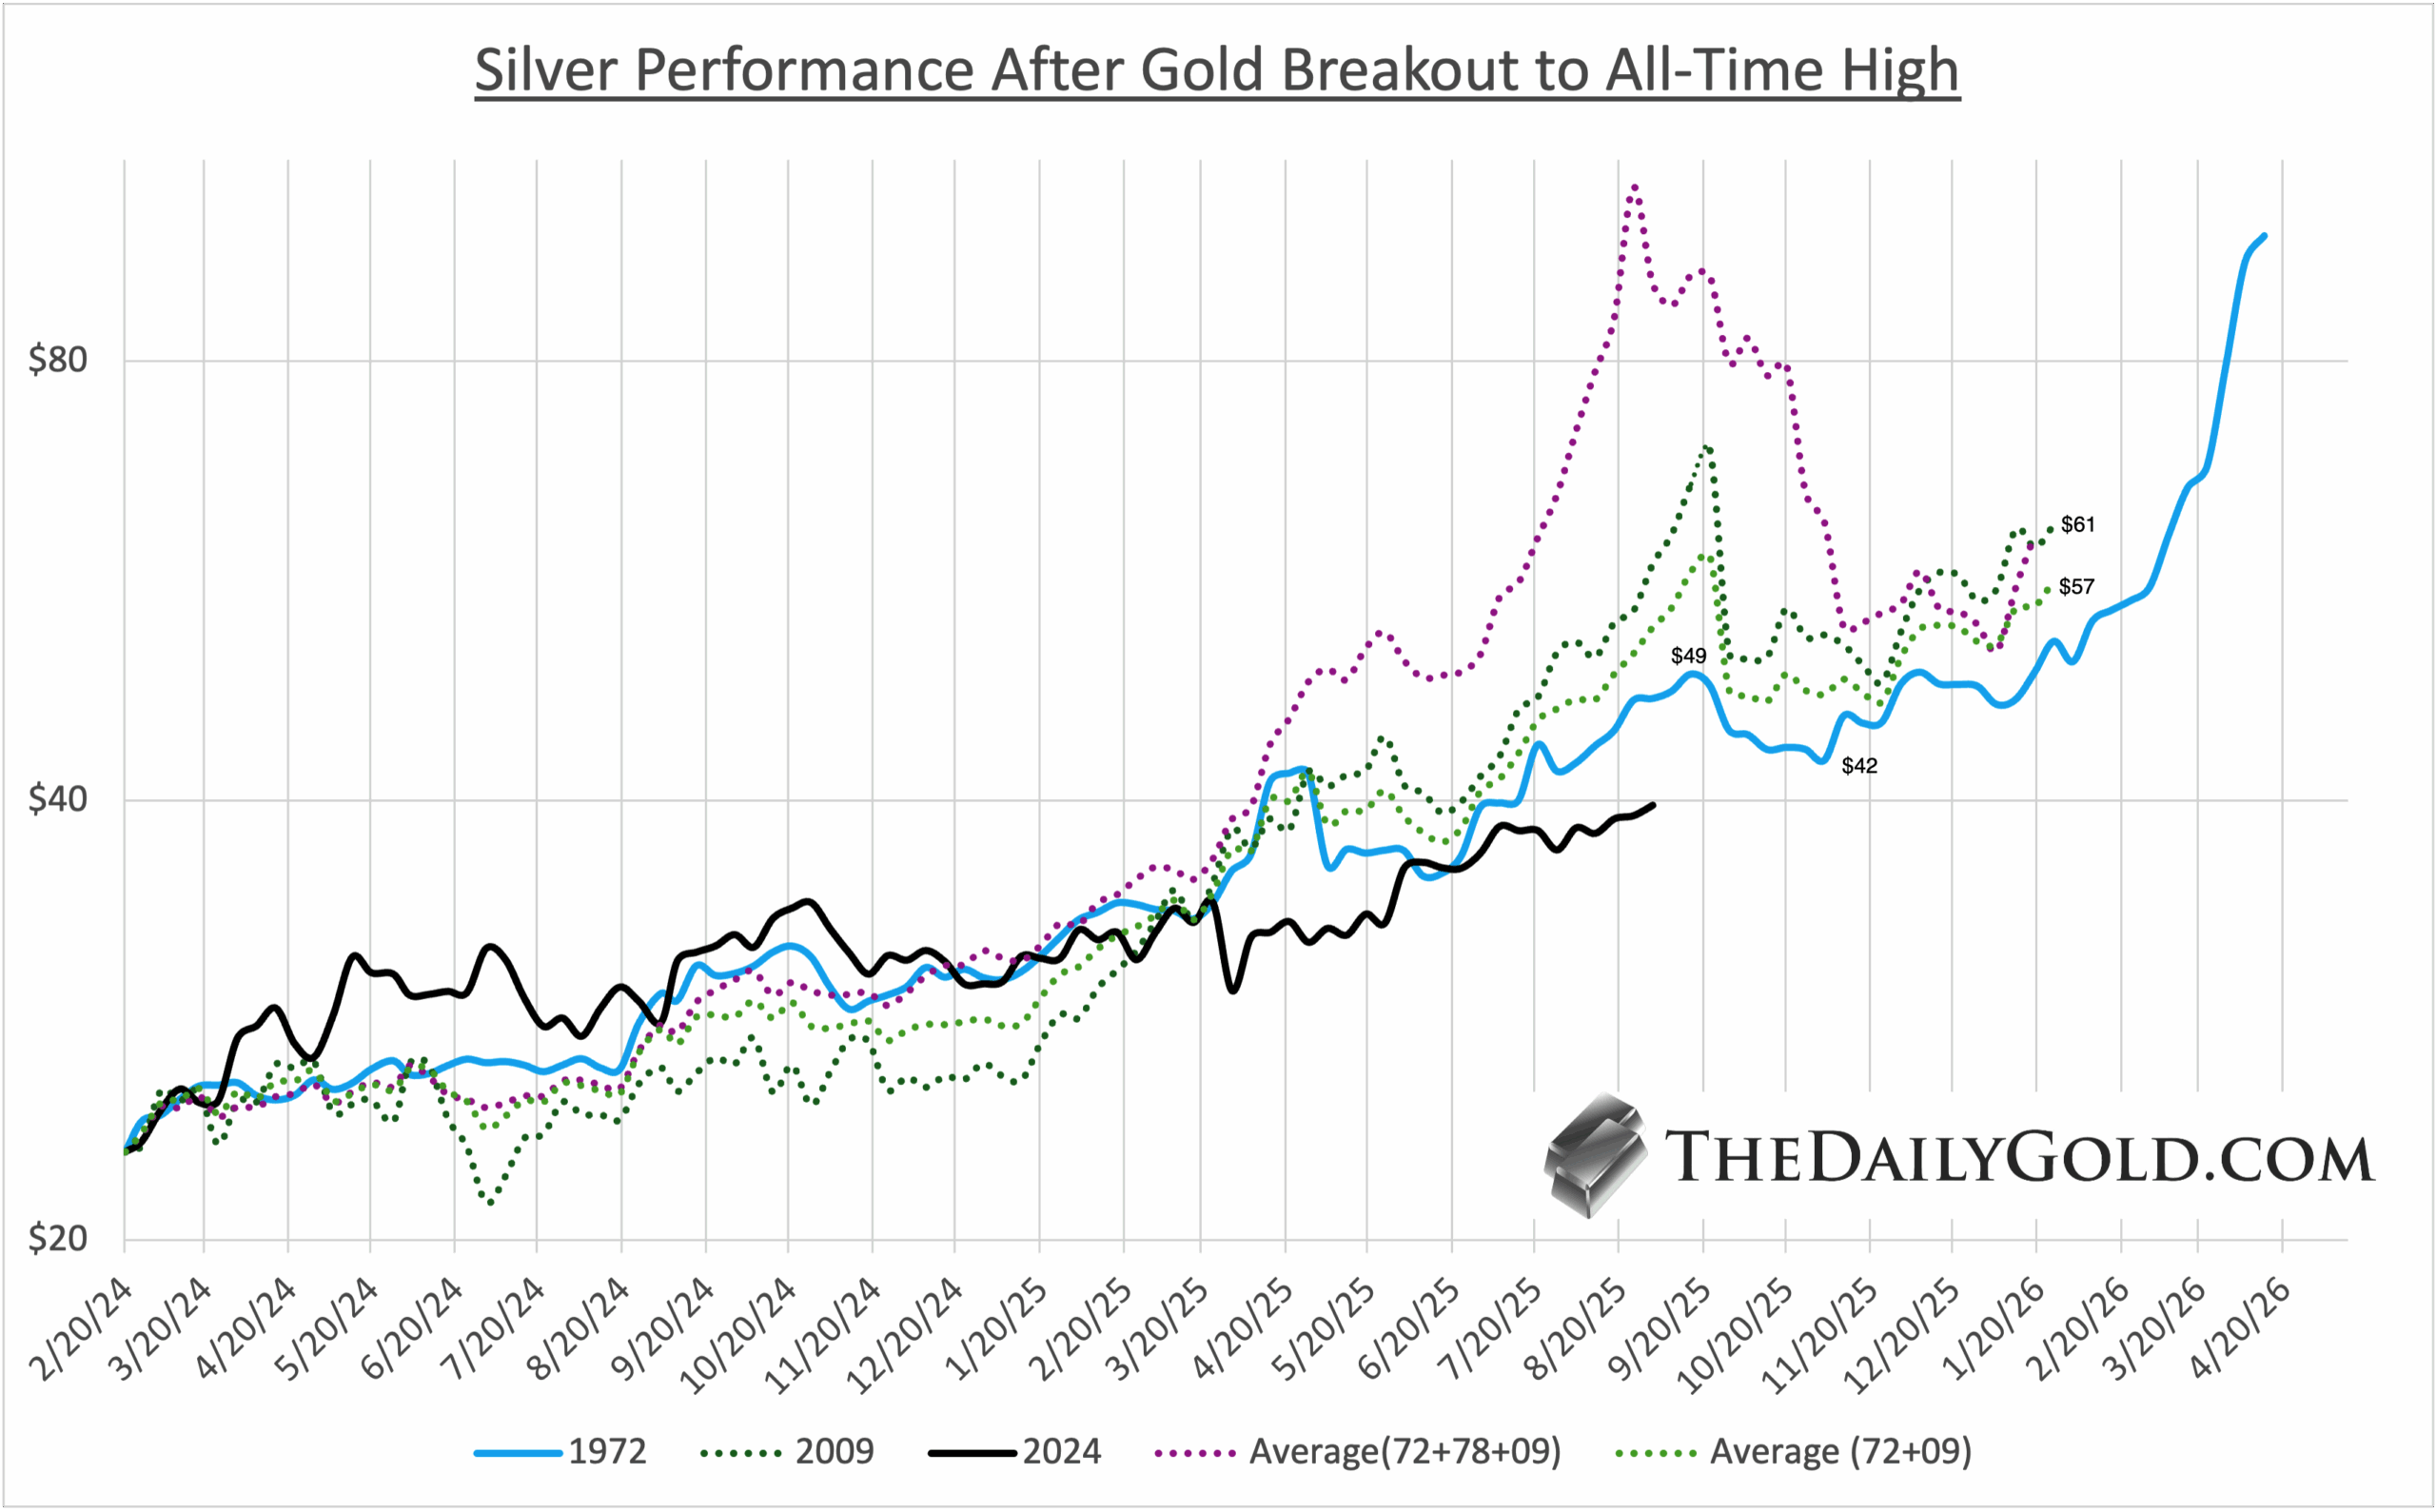
5) Silver After Gold Breakouts to All-Time Highs
We plot Silver's performance after the Gold Breakouts to new All-Time Highs in 1972, 1978 and 2009.
It's on the scale of the 2024
breakout.
I removed 1978-1980 from the chart but not the data.
There are two important observations from this chart.
First, when I continue the averages and 2009
post-peak, they coalesce around $60 in 4 months.
Second, Silver has somewhat followed the 1972 trajectory.
I love how 1972 on this scale hits $49 and then forms a perfect cup and handle pattern, bottoming at $42, before blasting through $50.
Could Silver, after reaching $49-$50, pullback to $42, currently the most significant resistance between $35-$37 and $50?