|
In this update...
- This Week in Markets
- Premium Sample: 5 Charts & Analysis
This Week in Markets...
Dave Skarica on Precious Metals
Dave gives his near-term outlook as well as his mid-term outlook. He also explains what might be the driving forces if this recovery evolves into a cyclical bull market.
Mickey Fulp on Commodities
Uranium stocks are slowly starting to emerge from their 2-3 year bases despite spot U prices hitting another low. Mickey explains why and also provides comments on Gold, Copper & China as well as thoughts on contrarian investing.
Quick Sponsor News item....
Balmoral Resources receives conditional approval for graduation to TSX
Balmoral will soon move from the Venture exchange to the senior, TSX exchange
5 Charts & Analysis:
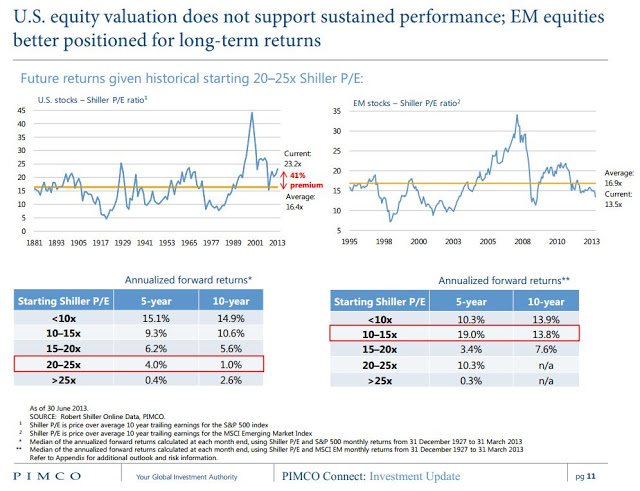
Today we published a 24-page Global Update. (Our global updates focus on commodities, bonds, equities and emerging markets). The update included this chart which projects future returns using the Shiller 10-year PE ratio. The chart shows that historically speaking, US equities are slightly expensive (but definitely expensive when you exclude the 1990s) while emerging markets are cheap. The lower valuations are (for a market as a whole) the stronger returns tend to be over time as there is a lot of room for valuation expansion. The median 5-year projected annual returns are 4% for US stocks and 19% for emerging markets. If you exclude the 1990s, the 4% becomes 2.5%. This is a pretty easy call...emerging markets will outperform strongly over the next 3-5 years.

Moving back to precious metals, here is an updated chart of Gold vs. the 4 big bubbles (Dow 1929, Gold 1980, Japan 1990, Nasdaq 2000). Note how the 4 big bubbles followed a very similar pattern as they busted. 2.5 years into the bust, the bubbles tend to be down 60% to 80%. Gold would have to reach $760 by next March to compare. It's not going to happen as Gold has likely already made a major low.
We looked at the 2004, 2006 and 2008 rebounds and combined them into one. We applied that to Gold's weekly bottom at $1212 and the result is below. Right now Gold's recovery is slightly ahead of the projection. Note that we didn't include Gold's recovery in 1976 in which it rallied 80% in 18 months. This projection has Gold reaching its old high in 19 months. From 1974-1976 Gold declined about 45% but 18 months later Gold was back at its old high.
Below is an index that is 50% Gold and 50% Silver. It's a simply way to combine the two. From 2004 to 2008 this index experienced three significant corrections of 23%, 23% and 42%. Yet, the secular bull remained intact and powered much higher over the next 2.5 years. Yes, the 2011-2013 downturn was sharp. Tell me, does this look like the end of the bull market? If it's not, then I can't fathom a better buying opportunity.
Last but not least is our favorite chart of all, because it signaled this major bottom. It's amazing how close E is to C. The trajectory, time and price of the two corrections are almost identical. E is also very close to D in time and price and identical to A in price.
At present, the gold stocks are consolidating as they usually do after the initial rebound from a major bottom. It's 3-4 weeks after the consolidation/correction when the recovery tends to shoot much higher. There is still time to get in before this recovery accelerates. This pause should give you plenty of time to get your portfolio in order and figure out which stocks you need to own and which you don't.
New subscribers are sent all recent updates and reports immediately. This includes a 30 page report on our top 5 growth-oriented producers (updated in recent weeks) and a 23 page report on 6 explorers & developers. A few days ago we published TDG 318 which charts our model portfolio holdings as well as those companies on our watch list. For our next update we plan to discuss how to build a portfolio and categorize the companies in terms of risk and potential. It's never a bad time to signup but now is a great time to consider a subscription.
Wishing you good health and profits,
-Jordan
Disclaimer: Sponsor Companies are paid sponsor companies of TheDailyGold.com website and this free newsletter. Do not construe sponsorship with a recommendation. The author of this newsletter is not a registered investment advisor. This newsletter is intended for informational and educational purposes only and should not be considered personalized and individualized investment advice. Investment in the precious metals sector contains significant risks. You should consult with an investment advisor and due your own due diligence. This email may contain certain forward looking statements which are subject to risks, uncertainties and a multitude of factors that can cause results and outcomes to differ materially from those discussed herein.
|
|