|
Here are the links for this past week.....
Gold Rebounds but Gold Miners Struggle
In my latest editorial I write that the relative weakness in Silver and the gold stocks especially, during the recent rebound in Gold is a warning sign. It's eerily reminiscent (to a degree) of the autumn of 2008. The charts continue to argue that more downside is almost inevitable before we see a major turn.
Latest Interview with Palisade Radio
This is a fairly long interview but be sure to read the summary as it covers the topics chronologically. That way you can skip around if you'd like. Collin asked me some rapid fire questions in regards to downside targets.
Tiho Brkan's latest thoughts on Gold & Silver
No one has called the twists and turns of the bear market better than Tiho Brkan. His views on the PMs are towards the bottom of this blog post.
Premium Snippets & Top 10
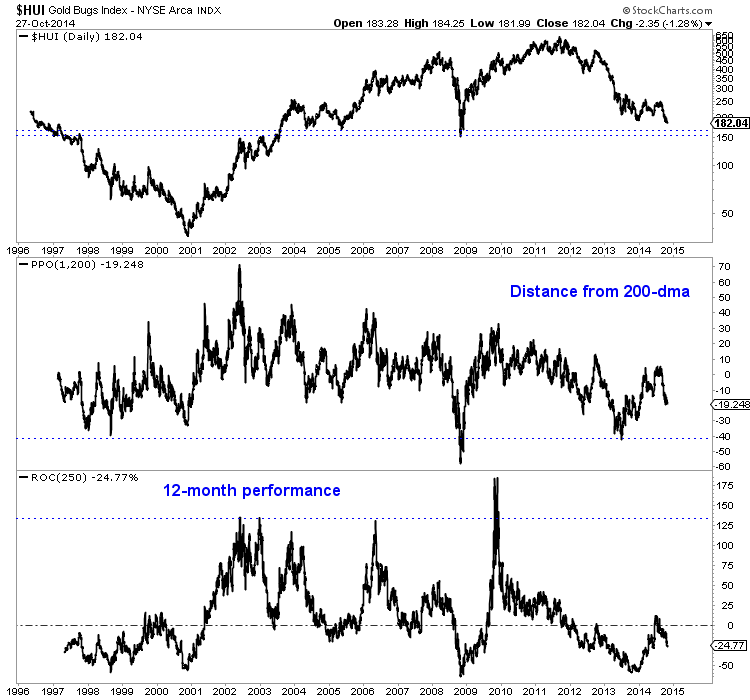
The first chart plots the HUI back to 1996. It includes two other plots: the HUI's distance from its 200-day exponential moving average and the 12-month performance of the HUI. There are a few things to to take from this chart.
First, the HUI has a range of support in the low 150s to 168, a level we've mentioned already. The pivot point in the low 150s dates back not only to 2002 but to 1997 as well. So its a very significant level. The second thing is the HUI is 19% below its 200-dma. This indicator puts oversold/overbought conditions in better perspective. Extremely oversold to me qualifies as 40%. Who knows where this will go but it's a
secondary indicator to use when trading.

The third thing, and we've mentioned it before, is the HUI's strong performance coming off major bottoms. At least four times in the past 13 years the HUI rallied 130% or more in a 12-month period. The junior sector has rallied as much as 200% inside of 12 months following these major bottoms. (That is a chart for another time). We are talking about GDXJ
type juniors, not penny juniors. These huge selloffs at the end of bear markets can act as a boomerang. Individual juniors can decline 30%-40% in a few weeks but then rebound 50-60% the month after they bottom. Obviously some backing and filling goes on, but you get the picture.
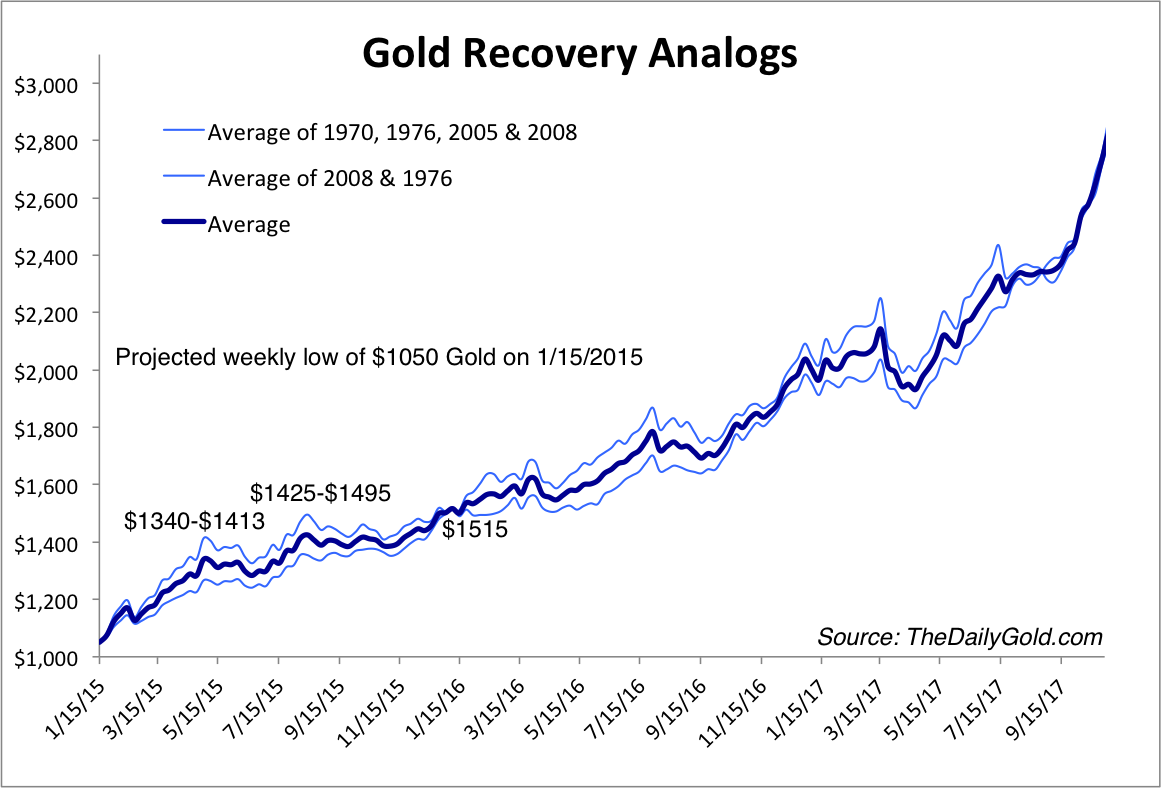
Below is an updated Gold recovery analog chart. It starts at $1050 on January 15, 2015. It uses weekly data so it doesn't preclude Gold from making a daily low well below $1050. In 2008 Gold's weekly low was $730 while its daily low was $705 and its tick low was $681. We apply the average of the four strongest recoveries in Gold and the average of the two strongest recoveries (1976, 2008). The thick blue line is the average of
those two lines. In this scenario Gold could rally back above $1300 quickly and then eventually to $1500 in the first 12 months.

When the breakout failed in September we turned defensive and gradually put our portfolio in position to first not lose any more capital and second to be in position to take advantage of the coming opportunity.
In addition, we've been researching companies closely and making our lists. We already published a top 5 report a month ago and yesterday we published our next 5. Call it a top 10. It is subject to change given price declines and changing fundamentals. We did mention a few other companies which did not make the top 10.
Here is some commentary that was part of the report:
…..We are looking for a combination of quality and upside potential. In terms of quality we are looking for strong management, strong financials, strong projects (by margin and size) and growth potential. Its true that some lower quality companies could appreciate the most in 2015-2016 but that is far too
speculative to pay attention to. We want the strongest companies with the highest odds of success and the most potential….
…...Producers are in a difficult spot and may lag in the early stages of the next bull market. Companies with large deposits that can make a lot of money at $1300 Gold will be at a premium. Majors and other potential acquirers are trying to survive the end of this bear market. When Gold bottoms and returns to $1300,
the majors will be in a better financial position and only then will start acquiring.
This Top 10 Report is a full 35 pages and 15,000 words long and is available with a subscription. Upon signup you will immediately receive all recent updates and important reports. Recently, we've published a Top 10 Stocks report, a Long-Term Precious Metals Outlook Report as well as a Global market update (with
a new one coming). You won't be disappointed with this material.
Consider a subscription to our premium service as I believe we have one of the best services available. We are the only
credentialed technical analyst who is the editor of a service. Secondly, we are one of only a few people who run a real money portfolio. That means our goals are 100% aligned with our subscribers. Weekly updates are sent on Saturdays while flash updates are sent when we make a trade. Reports are sent sporadically.
Thanks for reading. I wish you all great health and prosperity.
-Jordan
Disclaimer: Sponsor Companies are paid sponsor companies of TheDailyGold.com website and this free newsletter. Do not construe sponsorship with a recommendation. The author of this newsletter is not a registered investment advisor. This newsletter is intended for informational and educational purposes only and should not be considered personalized and individualized investment
advice. Investment in the precious metals sector contains significant risks. You should consult with an investment advisor and due your own due diligence before making any investment decisions. This email may contain certain forward looking statements which are subject to risks, uncertainties and a multitude of factors that can cause results and outcomes to differ materially from those discussed herein.
|
|