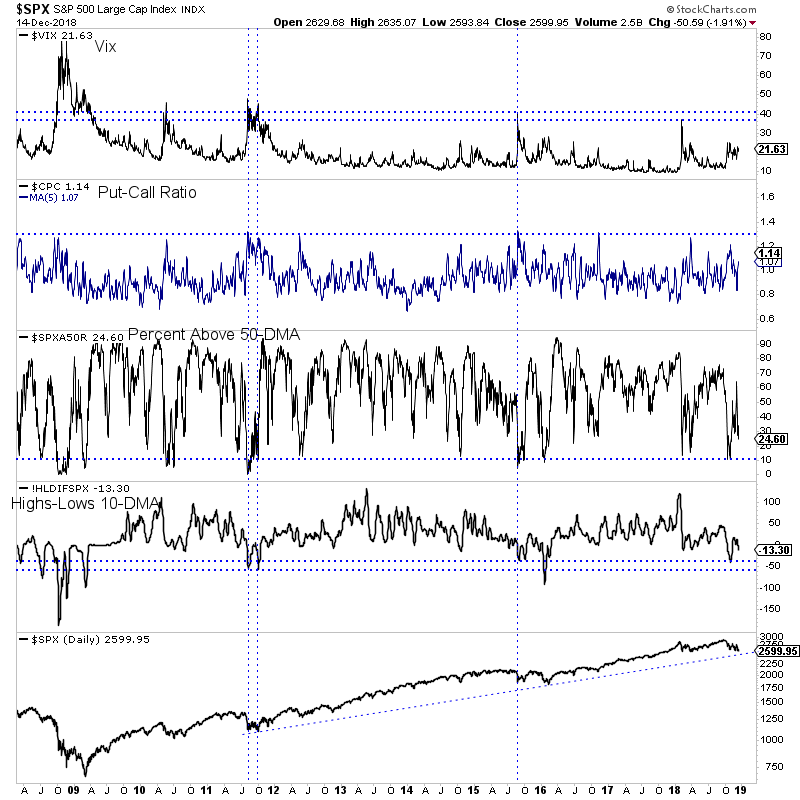
Chart 1: S&P 500 w/ Oversold Indicators
Here we plot 4 indicators that can help us determine when the stock market is at an oversold extreme. We have the Vix, the put-call ratio, the percentage of stocks above the 50-dma and new highs less new lows (with 10-dma).
These indicators still have some room to move before reaching an oversold extreme. That coupled with Friday's breakdown in the S&P 500 suggests more downside in the days ahead.
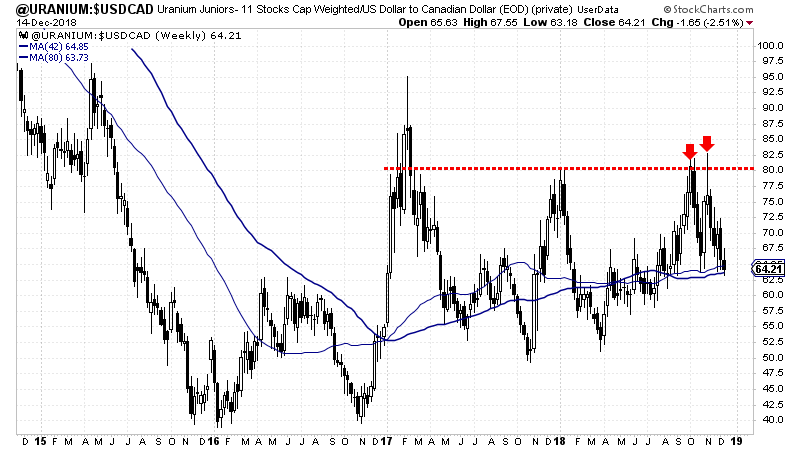
 Chart 2: Uranium Stocks
This is a weekly chart of a basket of 11 uranium stocks.
The index twice failed to break-out and sold off aggressively both times. Uranium stocks could be dead money over the next few quarters.
If they selloff more (index closed at 64 and below 60 would be interesting) then there could be some spots to accumulate. But for the most part, don't expect a breakout to the upside anytime soon. We took a chance weeks ago but were stopped out. Sometimes trades fail.

TheDailyGold Premium #600
|
We published TDG #600, a 27-page update Sunday morning. The update includes coverage on a few of our holdings with extended comments on three companies on our watch list. What would it take to make them buys?
Gold and gold stocks failed to surpass resistance this past week and sold off on Friday even as the stock market broke to a new low. Has the market already discounted a pause? What does the Fed have to say or do to keep the rally going?
What happens to Gold if/when the stock market enjoys a counter-trend rally?
