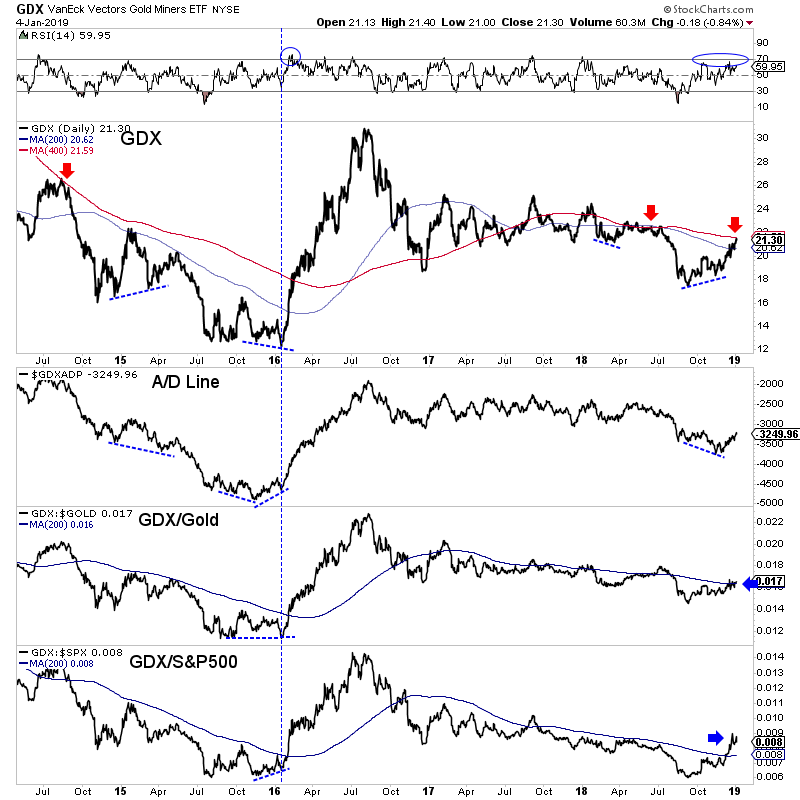
Chart 1: GDX w/ Indicators
Here is a daily chart of GDX that includes various indicators. The RSI is up top. Below GDX is its A/D line, and two ratios: GDX to Gold and GDX to S&P 500.
So GDX has rallied up to resistance at its 400-dma.
What is lacking right now is strong momentum, strong breadth and the GDX/Gold ratio is battling with its 200-dma. Confirmation of a new bull would involve sharper upside move in breadth, the GDX to Gold ratio surging above the 200-dma and the RSI piercing 70.

TheDailyGold Premium #603
|
