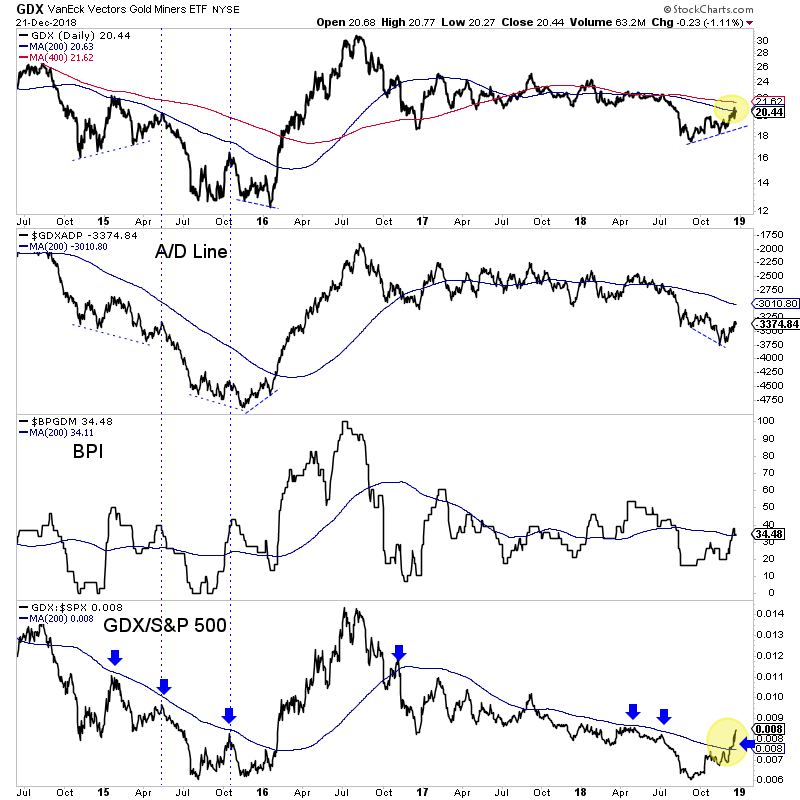
Chart 1: GDX w/ Breadth
Here we plot GDX with two breadth indicators (advance decline line and bullish percentage index) but also the GDX/S&P 500 ratio.
The price action and breadth (rallying up to the 200-dma with weak breadth) remind me of 2015, but note the aforementioned ratio. It has broken above its 200-dma. It never did that in 2015!

TheDailyGold Premium #601
|
We published TDG #601, a 19-page update Sunday morning. In this update we covered the near-term outlook as well as the setup for 2019. We also added two names to our watch list: one we owned in the past and one is a hot exploration stock that has sold off. Both could be great buys if they drop another 10%-15% from here.
Whether it takes a few days or a few weeks, the stock market's next move is likely higher and potentially for a few months. The breadth and sentiment indicators have reached serious oversold extremes.
How Gold and gold stocks perform during the coming rally in the stock market will tell us a lot moving forward.
In the update we also included exact info and data on how Gold and gold stocks have performed around the last rate hike and first hike of a new cycle. Is December the last hike? Or will it be March or June? The answer will help us know when the bull market in Gold and gold stocks will really begin.
Subscribe now and you'll find out which holding we are going to add to this week. It is a junior exploration company and some big names potentially could be financing it soon.
One of our watch list companies would become a great buy if it dropped another 15%. From there we see it having 10-fold potential if Gold returns to $1900/oz.
