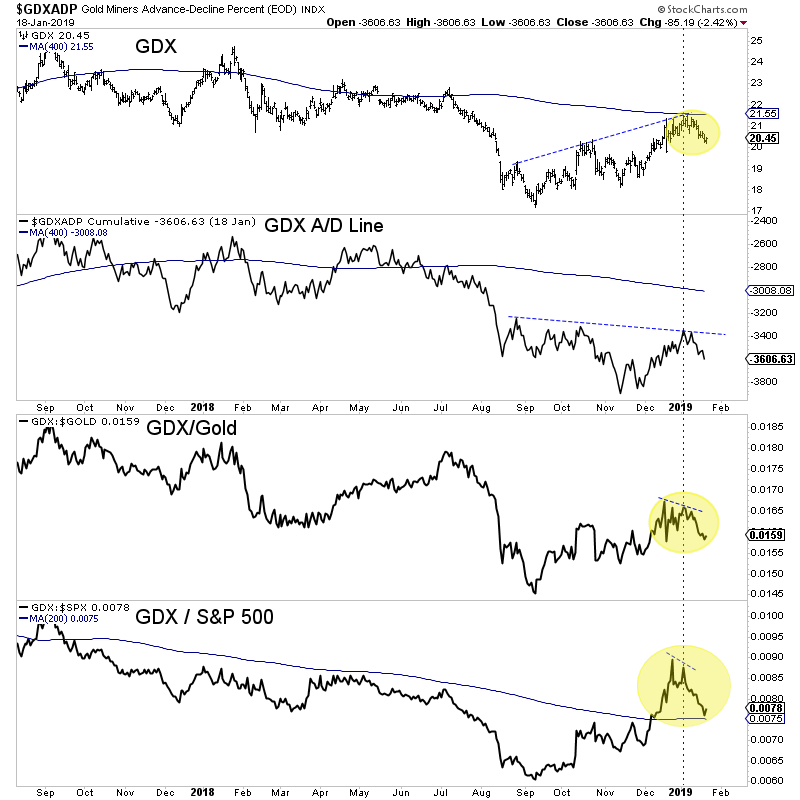
Chart 1: GDX & Indicators
We plot GDX along with its advance-decline line, the GDX/Gold ratio and the GDX/S&P 500 ratio.
Note that the indicators peaked before Gold. The A/D line peaked at the same time but in the larger picture is showing a strong negative divergence. It trended lower since August even as GDX rebounded.

TheDailyGold Premium #605
|
We published TDG #605, a 21-page update on Monday.
The gold stocks remain in a long-term downtrend and the next leg lower may have begun. That's the bad news. The good news is the market is very close to a shift in Fed policy and when that happens, a new bull market would begin. That view is also aligned with the technicals in the gold stocks which show some similarities to 2015.
We did not chase this rally and continued to hold a very high cash position.
Right now, the key is to accumulate value and things that can perform without the Gold price.
Also, this is the time to make a watch list of things that could become much better buys later this year.
Consider a subscription as we can keep you abreast of potential 5 and 10 baggers when the Fed does shift course.
