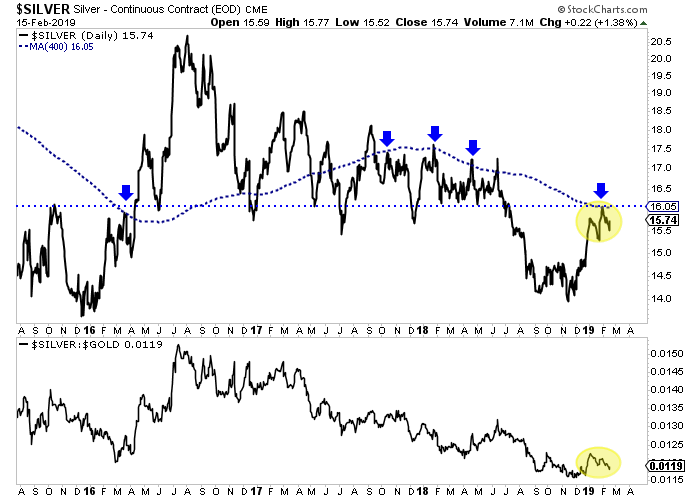
Chart 1: Silver Daily Chart
This is Silver with its 400-day moving average.
Note the confluence of resistance at $16.00. It was important support during 2017-2018 until it broke. Now its resistance on the way back up. Plus, that is where the 400-dma is and that marked several highs before the break last summer.
If Silver can surpass that resistance, it could reach a strong Fibonacci target of $17.40. That is 10% upside.

TheDailyGold Premium #609
|
TDG #609, a 29-page update was published and emailed to subscribers early Saturday evening.
This update included a report on one of our new buys, a lengthy Q&A section discussing preference for particular companies over others and notes on a few of our holdings.
Our new buy is a mid-cap company so its very liquid and easy for anyone to buy. Should the sector breakout in the next 12-18 months this company has 3x to 4x potential. Should Gold rally up to its measured target of $1700 it could have even 5x potential. It's also a timely buy technically.
Then on the junior side we noted how cheap one of our holdings is. There's a reason it hasn't moved but that will be rectified over the weeks ahead. Just based on this company's assets it has up to 6x potential if the sector breaks up and Gold reaches $1550. It has optionality but one of its projects has strong exploration potential.
We arrive at potential targets based on history, economic studies and valuations at various metals prices.
Consider a subscription as we can keep you abreast of sector developments and get you invested in the companies with 3x, 5x and 10x potential.
