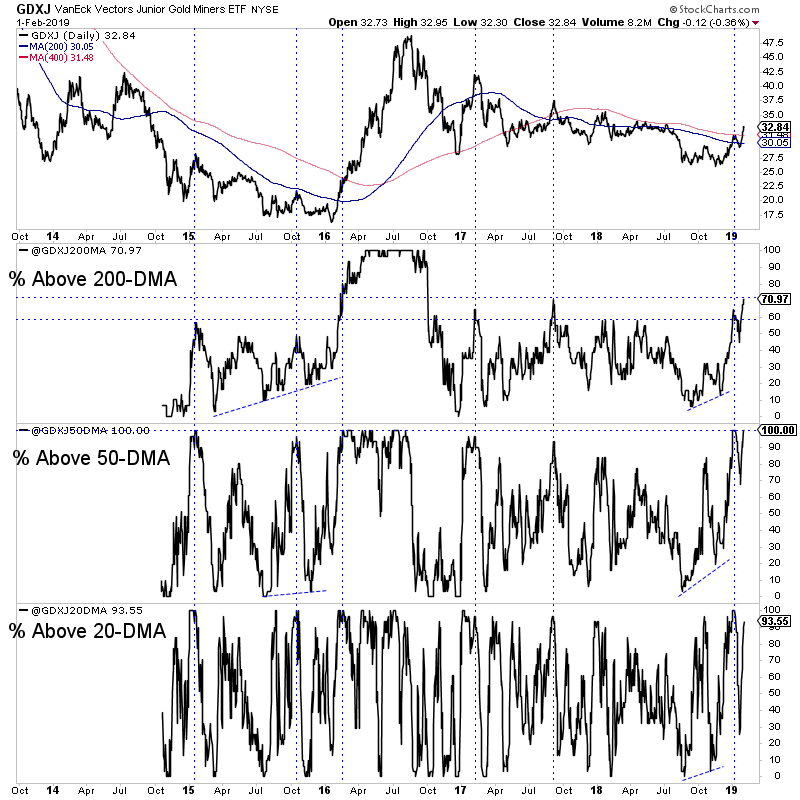
Chart 1: GDXJ & Breadth Indicators
We updated our GDXJ breadth indicators to cover only the top 35 stocks in GDXJ.
Note the the percentage of stocks above the 200-dma has reached 71%! Thats tied for the highest since summer 2016, with September 2017. Thats the only point comparable to now in terms of breadth and the moving averages.

TheDailyGold Premium #607
|
We published TDG #607 Saturday night, a 22-page update that included our thoughts on the sector trend as well as comments on watch list companies and more.
The miners exploded above key resistance (80-wma, 400-dma) and breadth has strengthened across the board. This was missing prior to the past 10 days. These things had to come to fruition before we could recognize a new bull market in the sector.
Right now, the evidence is accumulating in favor of the bulls. The risk to Gold would be the market is wrong right now and the Fed is able to hike once.
However, if the Fed really is done and the market is right then Gold is in great position for a major breakout this year. That's especially the case if the stock market rolls over and the Gold/S&P ratio pushes higher. That scenario leads to rate cuts and that equates to an explosive and sustainable breakout in Gold.
Consider a subscription as we can keep you abreast of the juniors with 5x and 10x potential as well as the lower risk companies that can double and triple.
