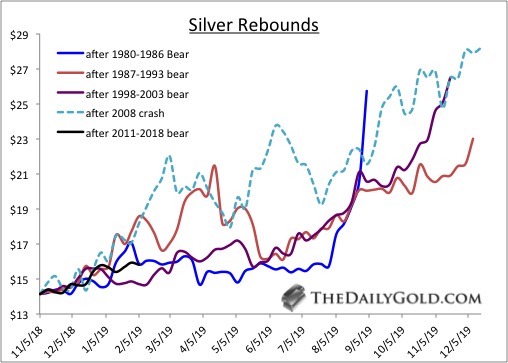
Chart 1: Silver Rebounds
There have been 4 mega-bear markets in Silver. The one that just ended or is ending is the second worst. In the chart below we plot the rebounds after all the mega-bears and we also include the 2008 crash.
Whenever Gold breaks the "wall" of resistance, we think it runs to $1550 and that could carry Silver towards $30/oz.

TheDailyGold Premium #608
|
TDG #608, a 25-page update was published and emailed to subscribers Sunday AM. In the update we covered our holdings and recent developments fairly extensively. The company notes & Q&A sections totaled 5 full page of text. (We currently have less than 10 companies).
Right now the sector is correcting and we soon should know if it will be a bullish consolidation or a real correction in which there is a risk the miners could test their 200-dma's again. Evidence has accumulated in favor of the bulls but there's been no confirmation yet.
How precious metals perform against the stock market is critical.
All but 1 position we own is capable of rising without a breakout in the Gold price. We did add a large and very liquid stock which we think could more than triple should Gold reach $1550/oz. Its chart shows its on the cusp of a breakout.
Consider a subscription as we can keep you abreast of sector developments and get you invested in the companies with 3x, 5x and 10x potential.
