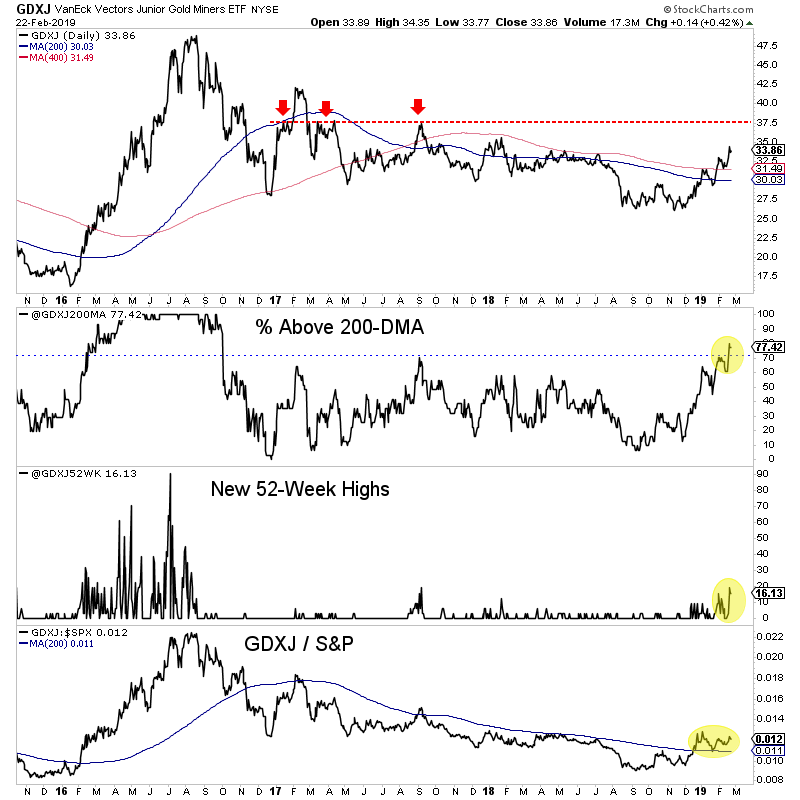
Chart 1: GDXJ w/Indicators
We plot GDXJ along with its 200-dma, 400-dma and red line resistance at $37.50.
The first two indicators are really critical for exactly where we are right now. And that is, trying to start and then confirm a new bull market. The percentage above the 200-dma hit 81% last week. Thats very strong. The percentage of new 52-week highs hit 20%.
Can GDXJ push up to strong resistance at $37 and take those figures up to 95% and 40%? It would offer more bullish evidence. Ultimately, if and when it corrects, as long as it holds above the 200-dma ($30) then thats another very bullish sign.

TheDailyGold Premium #610
|
TDG #610, a 26-page update was published and emailed to subscribers early Sunday AM.
We covered the near-term outlook for the sector and what could be in store for the spring. The stock market is outperforming Gold again but the gold stocks are showing strong breadth and good relative strength. That suggests recent strength isn't going to fade away quickly.
In the Q&A section we comment on a number of companies and most we don't own. One subscriber was looking for safe producers. We offered a company that is safer than a producer, has a US listing and is very liquid. Based on a $1900 Gold price the stock has up to 300% upside.
This week we also covered what is a ground floor opportunity in a junior silver company that is currently raising capital. (Accredited investors can contact me for more information). If Gold breaks to the upside and we get into a real bull market in the next 12-18 months, this stock is a minimum 5-bagger from here and potentially a 7 to 10 bagger.
Consider a subscription as we can keep you abreast of sector developments and get you invested in the companies with 3x, 5x and 10x potential.
