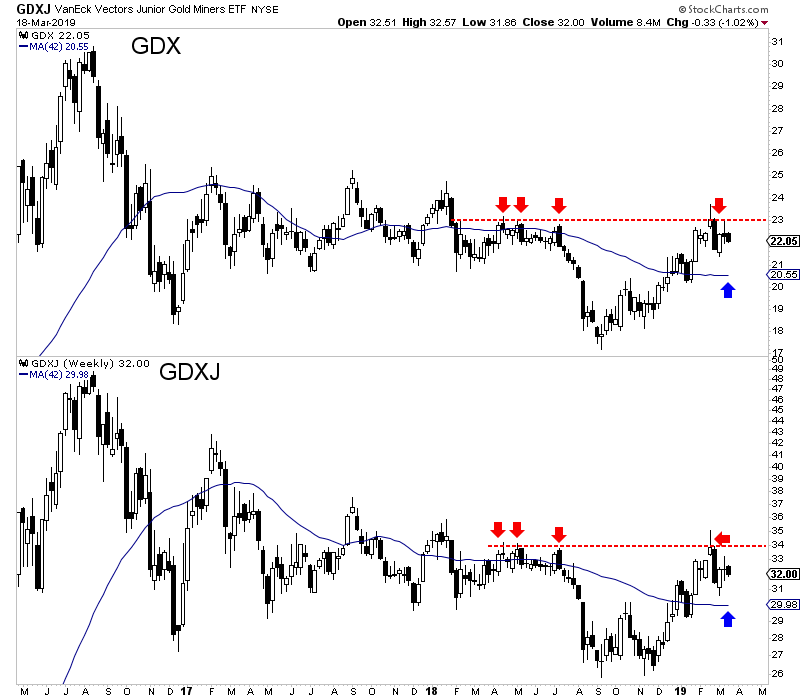
Chart 1: GDX & GDXJ Weekly
It's early in the week so the last candle is subject to change.
Weekly resistance is at $23 for GDX and $34 for GDXJ. The next important support is the 200-day moving averages (equivalent to 42-week moving averages right at $20.55 and $29.98. Thats 6%-7% downside.
Assuming GDX and GDXJ won't test those resistance levels for a while ($23 and $34), then they'll become even more important resistance in the future. A break above them in the future could help confirm a new bull market.

TheDailyGold Premium #613
|
TDG #613, a 28-page update was published and emailed to subscribers Saturday night.
The update includes a report on one of our favorite speculative explorers and Q&A on one of our other favorite exploration companies. These two companies have struggled in recent months due to a lack of news but will have plenty of catalysts coming up.
Our favorite speculative explorer will be drilling both of its projects over the months ahead and will have cash to follow up after summer. At the sector top in 2016 these two projects had a combined value of US $200 Million. This company now has an enterprise value of US ~$20 Million.
The weakness in the sector could continue and that's going to lead to buying opportunities in a handful of companies with strong exploration potential.
Consider a subscription as we can keep you abreast of sector developments and get you invested in the companies with 3x, 5x and 10x potential.
