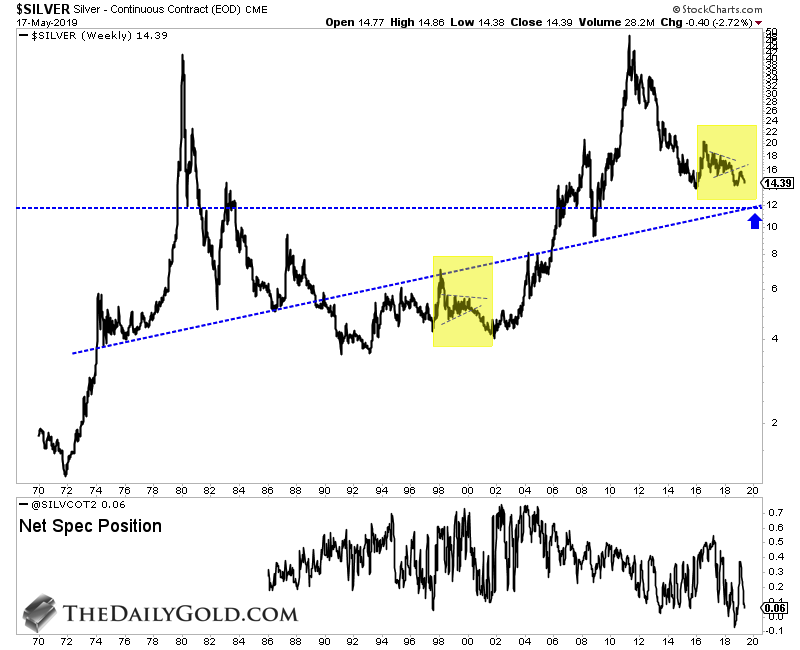
Chart 1: Silver Comparison to 1998-2001
Silver is following a similar path to 1998-2001. It recently "backtested" resistance after its breakdown and now it has resumed its decline. It could be a final decline.
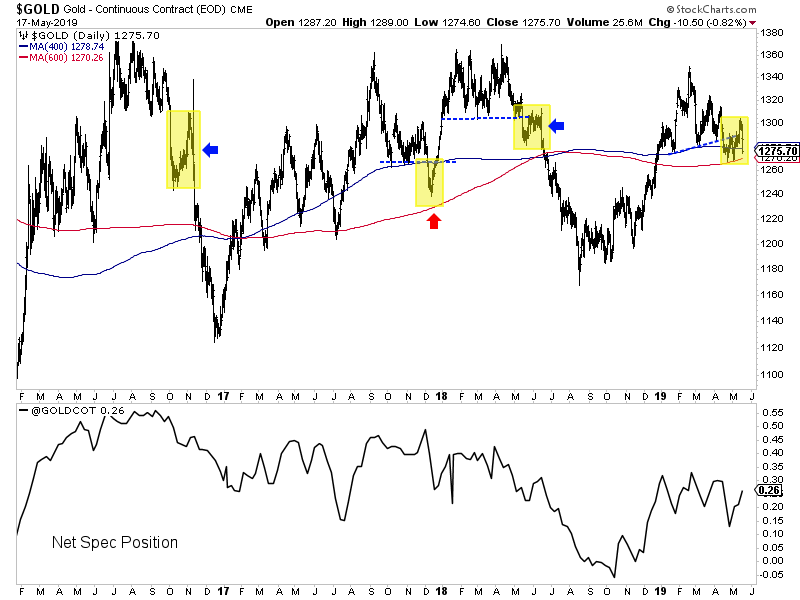
 Chart 1: Gold & Gold CoT
At the bottom we plot Gold's CoT. When Gold was at $1295, the CoT was at 26.4%. That's relatively high given Gold's technical position which is looking more precarious now.

TheDailyGold Premium #622
|
We published TDG #622, a 29-page update on Sunday morning.
In the past two weeks we've published reports on precious metals companies that fit a unique niche. These two companies have some downside protection but they also can share in the upside. If you are looking for companies you can buy and hold for a few years. These 2 are for you. If Gold begins a bull market, these two companies could go up 4x-5x over the next 3 years. If not, you aren't going to lose your shirt.
The technical outlook for the sector is not good. The dollar is breaking out and Silver is falling towards its lows. The above chart on Gold is worrisome. Miners are holding up okay for now.
When will it end? When is it time to buy and what should we buy?
Consider a subscription as we can keep you abreast of sector developments and get you invested in the companies with 3x, 5x and 10x potential.
