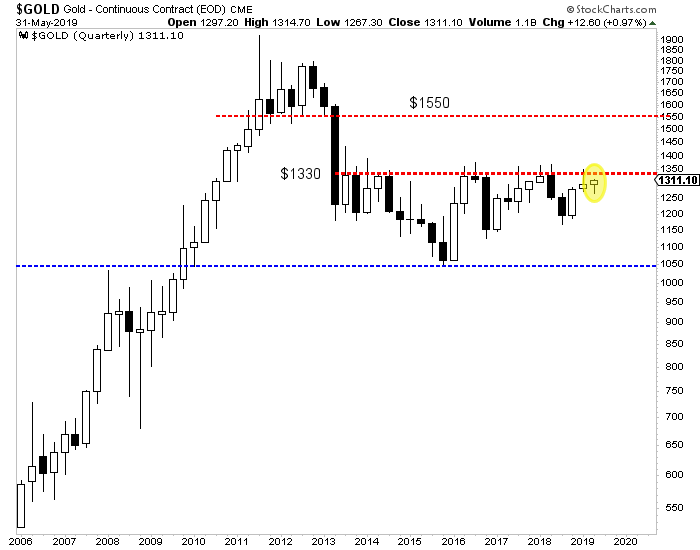
Chart 1: Gold Quarterly Chart
Gold has been unable to surpass $1330 on a quarterly basis. It has a bit of momentum now and June is the last month of the quarter. Can it close above $1330 on June 30?
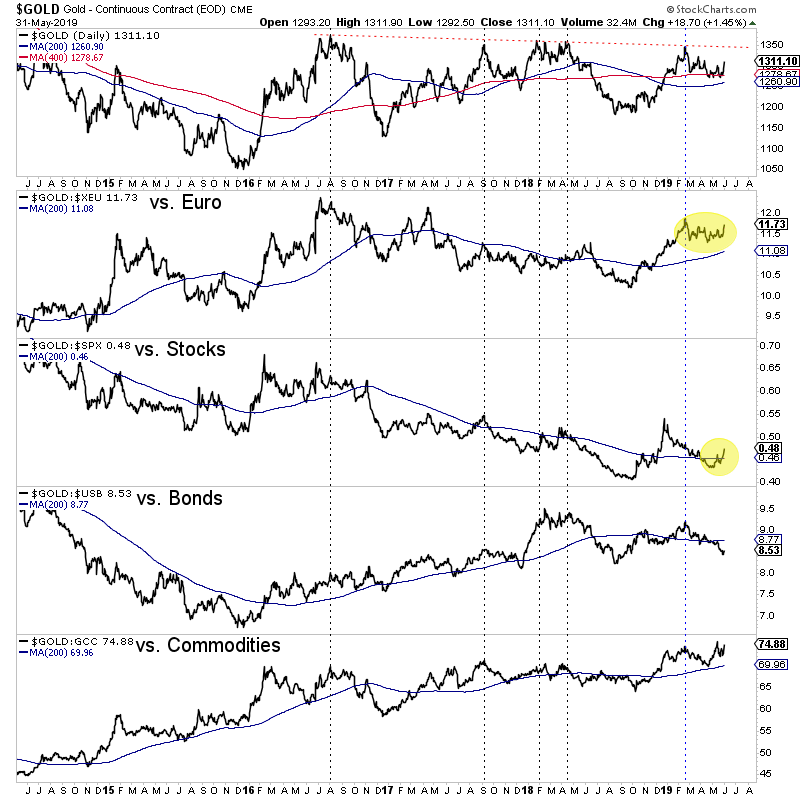
 Chart 2: Gold vs.
Here we plot Gold against the various asset classes. We use Gold/Euro as a proxy for Gold/Foreign Currencies.
First we want to see Gold/Euro takeout its February high and then its 2016 high. Second, Gold/Stocks is extremely important.

TheDailyGold Premium #623
|
We published TDG #623, a 14-page update on Sunday morning. This update included mostly text with some charts.
We wrote a few paragraphs on each stock we own and its current outlook. We also discussed the stock we are going to buy next week. At $1400 Gold in 2020, it has 4x-5x upside from here if the company executes.
Three of our holdings are in a great situation for this season. They are cheap and trading near long-term support. They are cashed up. And they are about to start important drill programs this summer. Two are going after significant targets. This is what you want as an investor. The risk is mostly priced out of these stocks. They won't be hurt if they miss. If they hit, each could double quickly.
Turning to the sector, it is poised to rally as the Fed cuts rates. The real question though is if the stock market and economy will enter a downturn or if the rate cuts will stabilize the situation and keep the expansion going. Note that there has never been a bull market in Gold without Gold/Stocks ratio rising alongside. That will tell us if the sector is setting up for another 2016 or new bull market.
Consider a subscription as we can keep you abreast of sector developments and get you invested in the companies with 3x, 5x and 10x potential. All of the stocks we own have upside potential without a move in the Gold price.
