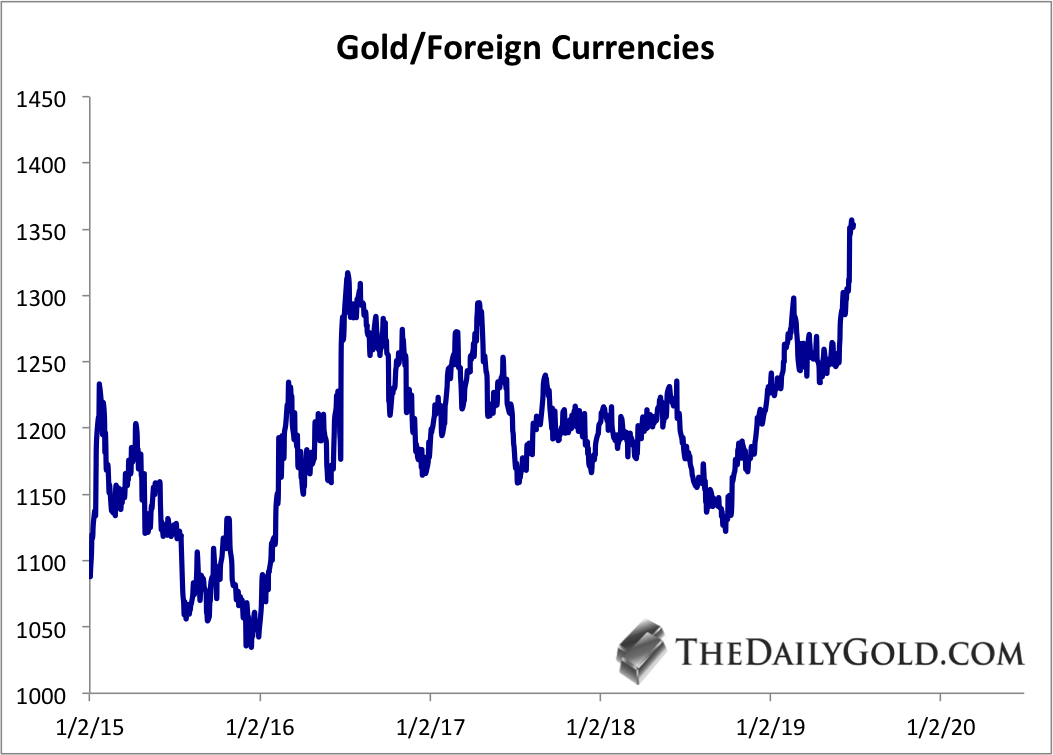
Chart 1: Gold/FC
Another way to look at Gold/FC is Gold x US$. They are the same.
I did not plot this back to the 2012 peak but take my word for it. Gold/FC, as you can see, surpassed its 2016 high and is roughly 5% from an all-time high. If Gold continues higher, could Gold/FC retest its all time high by the time Gold hits $1500?
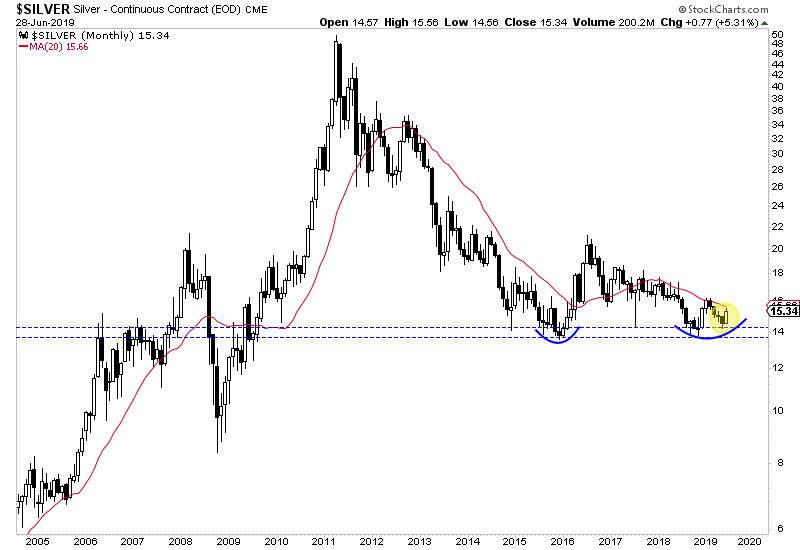
 Chart 2: Silver Monthly
Silver could be emerging from two double bottoms. The right side of a double bottom going back to 2015 is its own double bottom. June marked a bullish engulfing candle after a bit of a hammer in May.
A monthly close above $16 would put Silver in position to reach $18.

TheDailyGold Premium #628
|
